Ergebnis zur Landtagswahl 2013 am 20.01.2013
Wahlkreis Duderstadt - Landkreis Göttingen - Samtgemeinde Gieboldehausen - Gemeinde Bilshausen
Es wurden alle Wahlbezirke ausgewertet.
 Diagramm
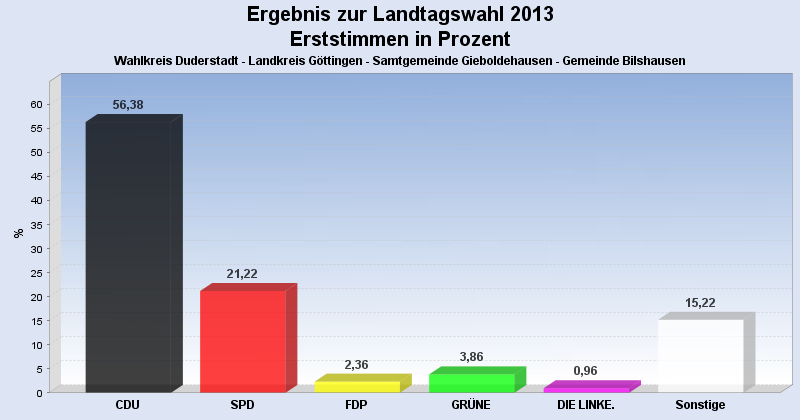
 Seitenanfang
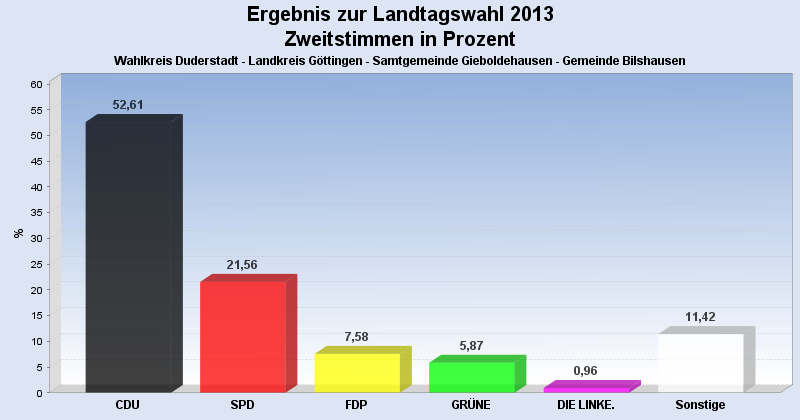
Wahlbeteiligung, Stimmzettel, Stimmen
| Wahlbeteiligung: | 49,53% |
|---|---|
| Stimmberechtigte: | 1.910 |
| Wähler: | 946 |
| Ungültige Erststimmen: | 13 |
| Gültige Erststimmen: | 933 |
| Ungültige Zweitstimmen: | 9 |
| Gültige Zweitstimmen: | 937 |
Erststimmen nach Wahlvorschlag
| Partei | Erststimmen | Prozent | |
|---|---|---|---|
| 1 | Koch, Lothar ( CDU ) | 526 | 56,38% |
| 2 | Glahn, Doris ( SPD ) | 198 | 21,22% |
| 3 | Duensing, Margret ( FDP ) | 22 | 2,36% |
| 4 | Kollenrott, Marie ( GRÜNE ) | 36 | 3,86% |
| 5 | Dr. Fascher, Eckhard ( DIE LINKE. ) | 9 | 0,96% |
| 12 | Ehbrecht, Dietmar ( FREIE WÄHLER ) | 126 | 13,50% |
| 20 | Richard, Klaus-Dieter ( PIRATEN ) | 16 | 1,71% |
Zweitstimmen nach Wahlvorschlag
| Partei | Zweitstimmen | Prozent | |
|---|---|---|---|
| 1 | CDU | 493 | 52,61% |
| 2 | SPD | 202 | 21,56% |
| 3 | FDP | 71 | 7,58% |
| 4 | GRÜNE | 55 | 5,87% |
| 5 | DIE LINKE. | 9 | 0,96% |
| 6 | Bündnis 21/RRP | 0 | 0,00% |
| 9 | DIE FREIHEIT Niedersachsen | 3 | 0,32% |
| 12 | FREIE WÄHLER | 75 | 8,00% |
| 14 | NPD | 4 | 0,43% |
| 16 | PBC | 0 | 0,00% |
| 20 | PIRATEN | 25 | 2,67% |
- Stand: 30.01.2013 14:17:40