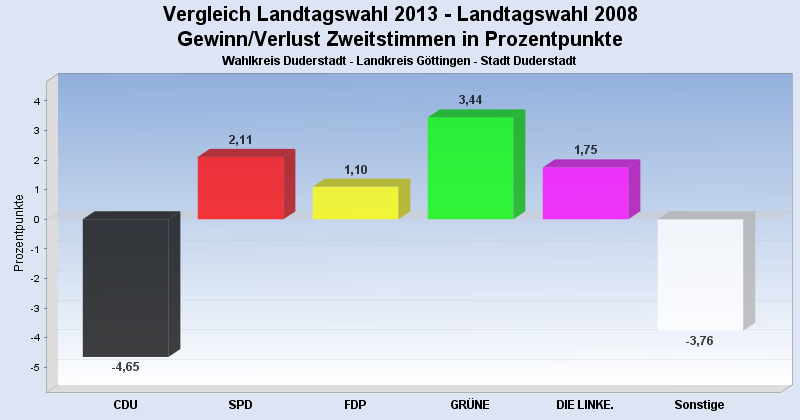
Ergebnis zur Landtagswahl 2013 am 20.01.2013
Wahlkreis Duderstadt - Landkreis Göttingen - Stadt Duderstadt
Es wurden alle Wahlbezirke ausgewertet.
 Diagramm
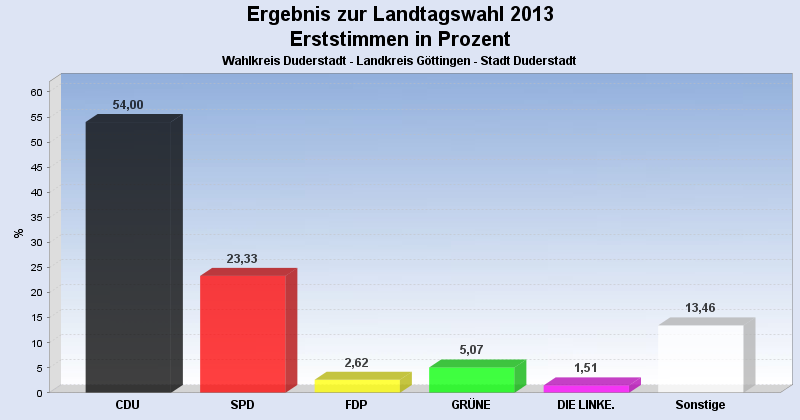
 Seitenanfang
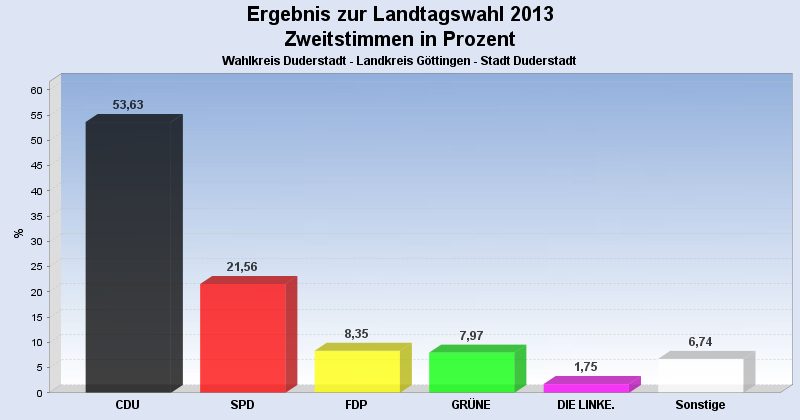
Wahlbeteiligung, Stimmzettel, Stimmen
| Wahlbeteiligung: | 58,44% |
|---|---|
| Stimmberechtigte: | 17.264 |
| Wähler: | 10.089 |
| Ungültige Erststimmen: | 137 |
| Gültige Erststimmen: | 9.952 |
| Ungültige Zweitstimmen: | 108 |
| Gültige Zweitstimmen: | 9.981 |
Erststimmen nach Wahlvorschlag
| Partei | Erststimmen | Prozent | |
|---|---|---|---|
| 1 | Koch, Lothar ( CDU ) | 5.374 | 54,00% |
| 2 | Glahn, Doris ( SPD ) | 2.322 | 23,33% |
| 3 | Duensing, Margret ( FDP ) | 261 | 2,62% |
| 4 | Kollenrott, Marie ( GRÜNE ) | 505 | 5,07% |
| 5 | Dr. Fascher, Eckhard ( DIE LINKE. ) | 150 | 1,51% |
| 12 | Ehbrecht, Dietmar ( FREIE WÄHLER ) | 1.223 | 12,29% |
| 20 | Richard, Klaus-Dieter ( PIRATEN ) | 117 | 1,18% |
Zweitstimmen nach Wahlvorschlag
| Partei | Zweitstimmen | Prozent | |
|---|---|---|---|
| 1 | CDU | 5.353 | 53,63% |
| 2 | SPD | 2.152 | 21,56% |
| 3 | FDP | 833 | 8,35% |
| 4 | GRÜNE | 795 | 7,97% |
| 5 | DIE LINKE. | 175 | 1,75% |
| 6 | Bündnis 21/RRP | 2 | 0,02% |
| 9 | DIE FREIHEIT Niedersachsen | 12 | 0,12% |
| 12 | FREIE WÄHLER | 457 | 4,58% |
| 14 | NPD | 85 | 0,85% |
| 16 | PBC | 3 | 0,03% |
| 20 | PIRATEN | 114 | 1,14% |
- Stand: 30.01.2013 14:17:44