Ergebnis zur Landtagswahl 2013 am 20.01.2013
Wahlkreis Duderstadt - Landkreis Göttingen - Samtgemeinde Radolfshausen - Gemeinde Ebergötzen
Es wurden alle Wahlbezirke ausgewertet.
 Diagramm
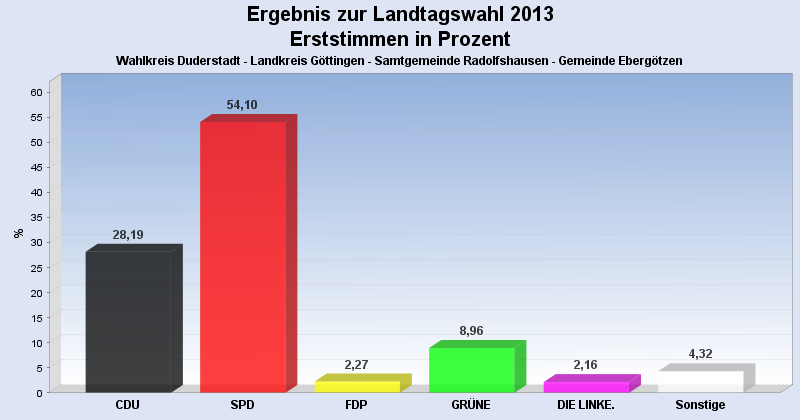
 Seitenanfang
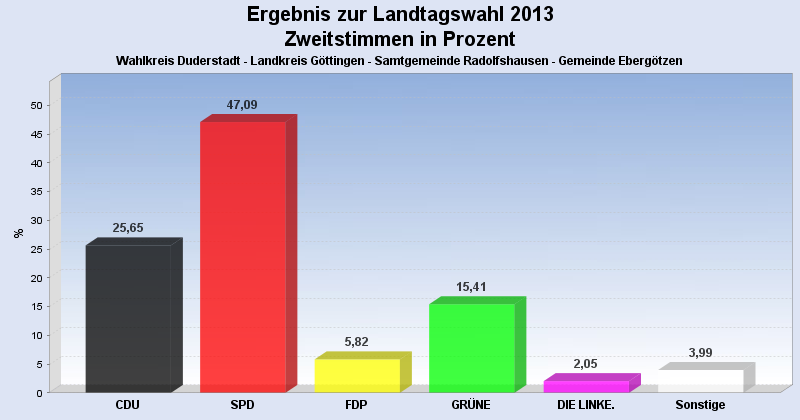
Wahlbeteiligung, Stimmzettel, Stimmen
| Wahlbeteiligung: | 60,05% |
|---|---|
| Stimmberechtigte: | 1.557 |
| Wähler: | 935 |
| Ungültige Erststimmen: | 9 |
| Gültige Erststimmen: | 926 |
| Ungültige Zweitstimmen: | 7 |
| Gültige Zweitstimmen: | 928 |
Erststimmen nach Wahlvorschlag
| Partei | Erststimmen | Prozent | |
|---|---|---|---|
| 1 | Koch, Lothar ( CDU ) | 261 | 28,19% |
| 2 | Glahn, Doris ( SPD ) | 501 | 54,10% |
| 3 | Duensing, Margret ( FDP ) | 21 | 2,27% |
| 4 | Kollenrott, Marie ( GRÜNE ) | 83 | 8,96% |
| 5 | Dr. Fascher, Eckhard ( DIE LINKE. ) | 20 | 2,16% |
| 12 | Ehbrecht, Dietmar ( FREIE WÄHLER ) | 30 | 3,24% |
| 20 | Richard, Klaus-Dieter ( PIRATEN ) | 10 | 1,08% |
Zweitstimmen nach Wahlvorschlag
| Partei | Zweitstimmen | Prozent | |
|---|---|---|---|
| 1 | CDU | 238 | 25,65% |
| 2 | SPD | 437 | 47,09% |
| 3 | FDP | 54 | 5,82% |
| 4 | GRÜNE | 143 | 15,41% |
| 5 | DIE LINKE. | 19 | 2,05% |
| 6 | Bündnis 21/RRP | 0 | 0,00% |
| 9 | DIE FREIHEIT Niedersachsen | 3 | 0,32% |
| 12 | FREIE WÄHLER | 17 | 1,83% |
| 14 | NPD | 7 | 0,75% |
| 16 | PBC | 1 | 0,11% |
| 20 | PIRATEN | 9 | 0,97% |
- Stand: 30.01.2013 14:18:04