Ergebnis zur Landtagswahl 2013 am 20.01.2013
Wahlkreis Duderstadt - Landkreis Göttingen - Gemeinde Friedland
Es wurden alle Wahlbezirke ausgewertet.
 Diagramm
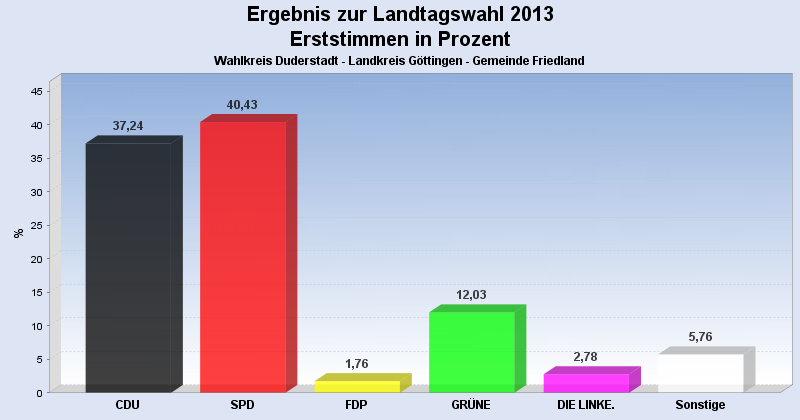
 Seitenanfang
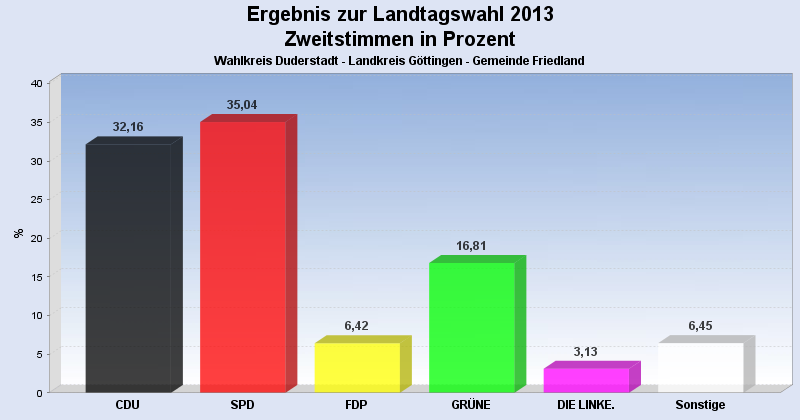
Wahlbeteiligung, Stimmzettel, Stimmen
| Wahlbeteiligung: | 65,93% |
|---|---|
| Stimmberechtigte: | 5.688 |
| Wähler: | 3.750 |
| Ungültige Erststimmen: | 50 |
| Gültige Erststimmen: | 3.700 |
| Ungültige Zweitstimmen: | 43 |
| Gültige Zweitstimmen: | 3.707 |
Erststimmen nach Wahlvorschlag
| Partei | Erststimmen | Prozent | |
|---|---|---|---|
| 1 | Koch, Lothar ( CDU ) | 1.378 | 37,24% |
| 2 | Glahn, Doris ( SPD ) | 1.496 | 40,43% |
| 3 | Duensing, Margret ( FDP ) | 65 | 1,76% |
| 4 | Kollenrott, Marie ( GRÜNE ) | 445 | 12,03% |
| 5 | Dr. Fascher, Eckhard ( DIE LINKE. ) | 103 | 2,78% |
| 12 | Ehbrecht, Dietmar ( FREIE WÄHLER ) | 138 | 3,73% |
| 20 | Richard, Klaus-Dieter ( PIRATEN ) | 75 | 2,03% |
Zweitstimmen nach Wahlvorschlag
| Partei | Zweitstimmen | Prozent | |
|---|---|---|---|
| 1 | CDU | 1.192 | 32,16% |
| 2 | SPD | 1.299 | 35,04% |
| 3 | FDP | 238 | 6,42% |
| 4 | GRÜNE | 623 | 16,81% |
| 5 | DIE LINKE. | 116 | 3,13% |
| 6 | Bündnis 21/RRP | 0 | 0,00% |
| 9 | DIE FREIHEIT Niedersachsen | 15 | 0,40% |
| 12 | FREIE WÄHLER | 95 | 2,56% |
| 14 | NPD | 38 | 1,03% |
| 16 | PBC | 6 | 0,16% |
| 20 | PIRATEN | 85 | 2,29% |
- Stand: 30.01.2013 14:18:06