Ergebnis zur Landtagswahl 2013 am 20.01.2013
Wahlkreis Duderstadt - Landkreis Göttingen - Gemeinde Gleichen
Es wurden alle Wahlbezirke ausgewertet.
 Diagramm
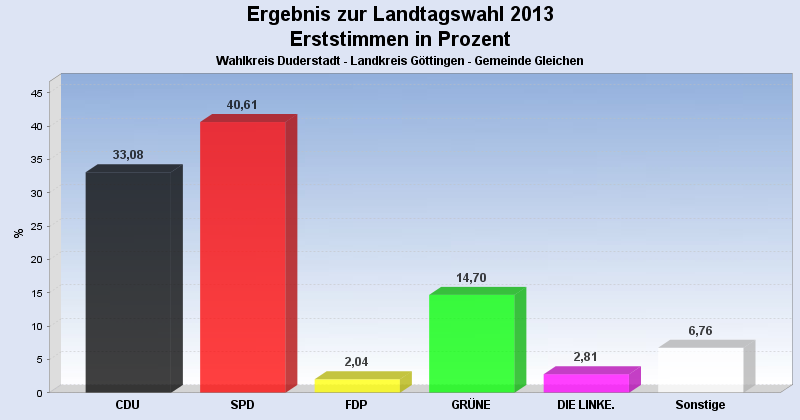
 Seitenanfang
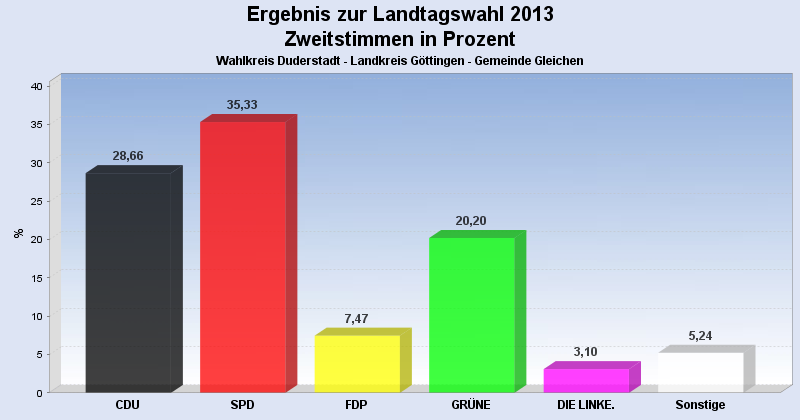
Wahlbeteiligung, Stimmzettel, Stimmen
| Wahlbeteiligung: | 69,94% |
|---|---|
| Stimmberechtigte: | 7.176 |
| Wähler: | 5.019 |
| Ungültige Erststimmen: | 65 |
| Gültige Erststimmen: | 4.954 |
| Ungültige Zweitstimmen: | 54 |
| Gültige Zweitstimmen: | 4.965 |
Erststimmen nach Wahlvorschlag
| Partei | Erststimmen | Prozent | |
|---|---|---|---|
| 1 | Koch, Lothar ( CDU ) | 1.639 | 33,08% |
| 2 | Glahn, Doris ( SPD ) | 2.012 | 40,61% |
| 3 | Duensing, Margret ( FDP ) | 101 | 2,04% |
| 4 | Kollenrott, Marie ( GRÜNE ) | 728 | 14,70% |
| 5 | Dr. Fascher, Eckhard ( DIE LINKE. ) | 139 | 2,81% |
| 12 | Ehbrecht, Dietmar ( FREIE WÄHLER ) | 270 | 5,45% |
| 20 | Richard, Klaus-Dieter ( PIRATEN ) | 65 | 1,31% |
Zweitstimmen nach Wahlvorschlag
| Partei | Zweitstimmen | Prozent | |
|---|---|---|---|
| 1 | CDU | 1.423 | 28,66% |
| 2 | SPD | 1.754 | 35,33% |
| 3 | FDP | 371 | 7,47% |
| 4 | GRÜNE | 1.003 | 20,20% |
| 5 | DIE LINKE. | 154 | 3,10% |
| 6 | Bündnis 21/RRP | 0 | 0,00% |
| 9 | DIE FREIHEIT Niedersachsen | 15 | 0,30% |
| 12 | FREIE WÄHLER | 149 | 3,00% |
| 14 | NPD | 24 | 0,48% |
| 16 | PBC | 3 | 0,06% |
| 20 | PIRATEN | 69 | 1,39% |
- Stand: 30.01.2013 14:18:22