Ergebnis zur Landtagswahl 2013 am 20.01.2013
Wahlkreis Duderstadt - Landkreis Göttingen - Samtgemeinde Radolfshausen - Gemeinde Landolfshausen
Es wurden alle Wahlbezirke ausgewertet.
 Diagramm
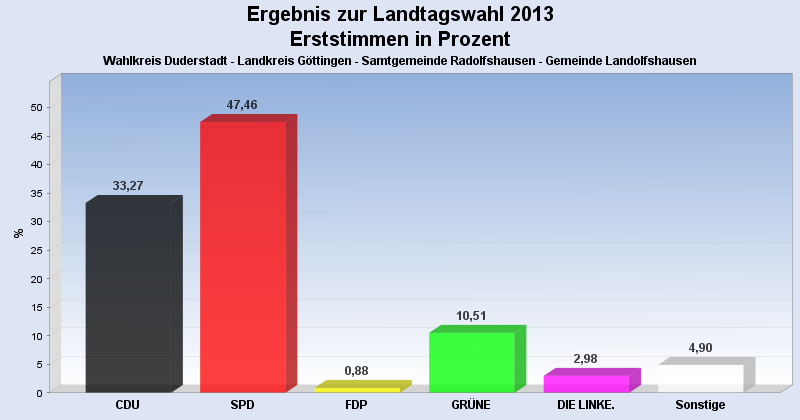
 Seitenanfang
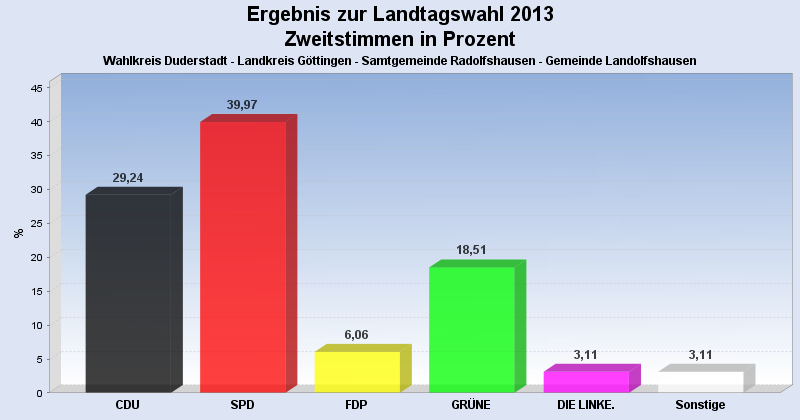
Wahlbeteiligung, Stimmzettel, Stimmen
| Wahlbeteiligung: | 65,77% |
|---|---|
| Stimmberechtigte: | 888 |
| Wähler: | 584 |
| Ungültige Erststimmen: | 13 |
| Gültige Erststimmen: | 571 |
| Ungültige Zweitstimmen: | 6 |
| Gültige Zweitstimmen: | 578 |
Erststimmen nach Wahlvorschlag
| Partei | Erststimmen | Prozent | |
|---|---|---|---|
| 1 | Koch, Lothar ( CDU ) | 190 | 33,27% |
| 2 | Glahn, Doris ( SPD ) | 271 | 47,46% |
| 3 | Duensing, Margret ( FDP ) | 5 | 0,88% |
| 4 | Kollenrott, Marie ( GRÜNE ) | 60 | 10,51% |
| 5 | Dr. Fascher, Eckhard ( DIE LINKE. ) | 17 | 2,98% |
| 12 | Ehbrecht, Dietmar ( FREIE WÄHLER ) | 23 | 4,03% |
| 20 | Richard, Klaus-Dieter ( PIRATEN ) | 5 | 0,88% |
Zweitstimmen nach Wahlvorschlag
| Partei | Zweitstimmen | Prozent | |
|---|---|---|---|
| 1 | CDU | 169 | 29,24% |
| 2 | SPD | 231 | 39,97% |
| 3 | FDP | 35 | 6,06% |
| 4 | GRÜNE | 107 | 18,51% |
| 5 | DIE LINKE. | 18 | 3,11% |
| 6 | Bündnis 21/RRP | 0 | 0,00% |
| 9 | DIE FREIHEIT Niedersachsen | 1 | 0,17% |
| 12 | FREIE WÄHLER | 10 | 1,73% |
| 14 | NPD | 1 | 0,17% |
| 16 | PBC | 0 | 0,00% |
| 20 | PIRATEN | 6 | 1,04% |
- Stand: 30.01.2013 14:18:37