Ergebnis zur Landtagswahl 2013 am 20.01.2013
Wahlkreis Duderstadt - Landkreis Göttingen - Samtgemeinde Gieboldehausen - Gemeinde Rhumspringe
Es wurden alle Wahlbezirke ausgewertet.
 Diagramm
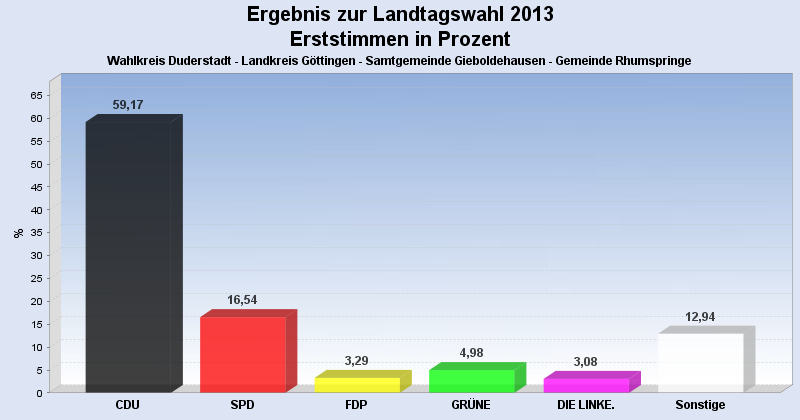
 Seitenanfang
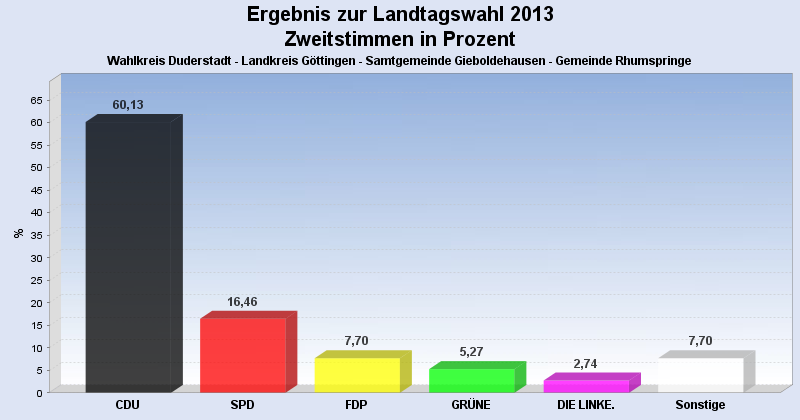
Wahlbeteiligung, Stimmzettel, Stimmen
| Wahlbeteiligung: | 62,36% |
|---|---|
| Stimmberechtigte: | 1.533 |
| Wähler: | 956 |
| Ungültige Erststimmen: | 13 |
| Gültige Erststimmen: | 943 |
| Ungültige Zweitstimmen: | 8 |
| Gültige Zweitstimmen: | 948 |
Erststimmen nach Wahlvorschlag
| Partei | Erststimmen | Prozent | |
|---|---|---|---|
| 1 | Koch, Lothar ( CDU ) | 558 | 59,17% |
| 2 | Glahn, Doris ( SPD ) | 156 | 16,54% |
| 3 | Duensing, Margret ( FDP ) | 31 | 3,29% |
| 4 | Kollenrott, Marie ( GRÜNE ) | 47 | 4,98% |
| 5 | Dr. Fascher, Eckhard ( DIE LINKE. ) | 29 | 3,08% |
| 12 | Ehbrecht, Dietmar ( FREIE WÄHLER ) | 108 | 11,45% |
| 20 | Richard, Klaus-Dieter ( PIRATEN ) | 14 | 1,48% |
Zweitstimmen nach Wahlvorschlag
| Partei | Zweitstimmen | Prozent | |
|---|---|---|---|
| 1 | CDU | 570 | 60,13% |
| 2 | SPD | 156 | 16,46% |
| 3 | FDP | 73 | 7,70% |
| 4 | GRÜNE | 50 | 5,27% |
| 5 | DIE LINKE. | 26 | 2,74% |
| 6 | Bündnis 21/RRP | 0 | 0,00% |
| 9 | DIE FREIHEIT Niedersachsen | 2 | 0,21% |
| 12 | FREIE WÄHLER | 49 | 5,17% |
| 14 | NPD | 13 | 1,37% |
| 16 | PBC | 1 | 0,11% |
| 20 | PIRATEN | 8 | 0,84% |
- Stand: 30.01.2013 14:18:43