Ergebnis zur Landtagswahl 2013 am 20.01.2013
Wahlkreis Duderstadt - Landkreis Göttingen - Gemeinde Rosdorf
Es wurden alle Wahlbezirke ausgewertet.
 Diagramm
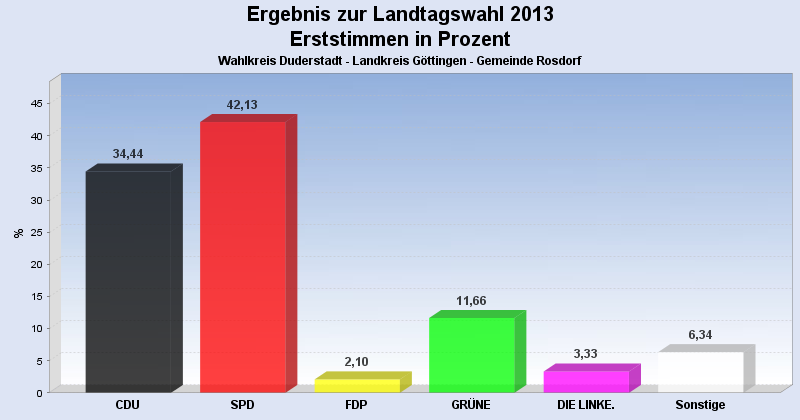
 Seitenanfang
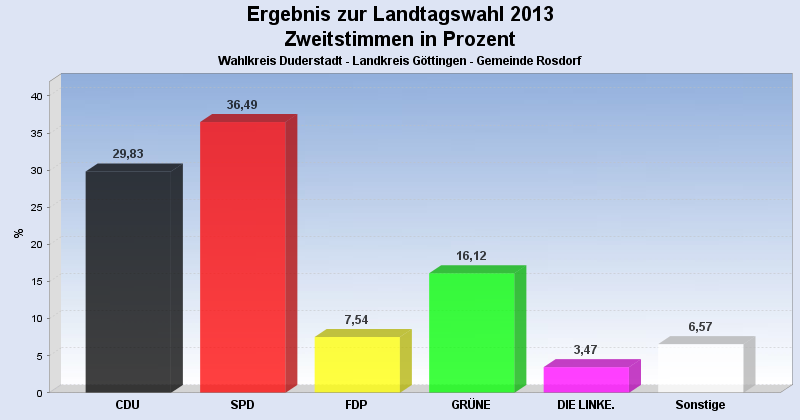
Wahlbeteiligung, Stimmzettel, Stimmen
| Wahlbeteiligung: | 58,56% |
|---|---|
| Stimmberechtigte: | 9.274 |
| Wähler: | 5.431 |
| Ungültige Erststimmen: | 86 |
| Gültige Erststimmen: | 5.345 |
| Ungültige Zweitstimmen: | 70 |
| Gültige Zweitstimmen: | 5.361 |
Erststimmen nach Wahlvorschlag
| Partei | Erststimmen | Prozent | |
|---|---|---|---|
| 1 | Koch, Lothar ( CDU ) | 1.841 | 34,44% |
| 2 | Glahn, Doris ( SPD ) | 2.252 | 42,13% |
| 3 | Duensing, Margret ( FDP ) | 112 | 2,10% |
| 4 | Kollenrott, Marie ( GRÜNE ) | 623 | 11,66% |
| 5 | Dr. Fascher, Eckhard ( DIE LINKE. ) | 178 | 3,33% |
| 12 | Ehbrecht, Dietmar ( FREIE WÄHLER ) | 236 | 4,42% |
| 20 | Richard, Klaus-Dieter ( PIRATEN ) | 103 | 1,93% |
Zweitstimmen nach Wahlvorschlag
| Partei | Zweitstimmen | Prozent | |
|---|---|---|---|
| 1 | CDU | 1.599 | 29,83% |
| 2 | SPD | 1.956 | 36,49% |
| 3 | FDP | 404 | 7,54% |
| 4 | GRÜNE | 864 | 16,12% |
| 5 | DIE LINKE. | 186 | 3,47% |
| 6 | Bündnis 21/RRP | 2 | 0,04% |
| 9 | DIE FREIHEIT Niedersachsen | 24 | 0,45% |
| 12 | FREIE WÄHLER | 153 | 2,85% |
| 14 | NPD | 54 | 1,01% |
| 16 | PBC | 5 | 0,09% |
| 20 | PIRATEN | 114 | 2,13% |
- Stand: 30.01.2013 14:18:48