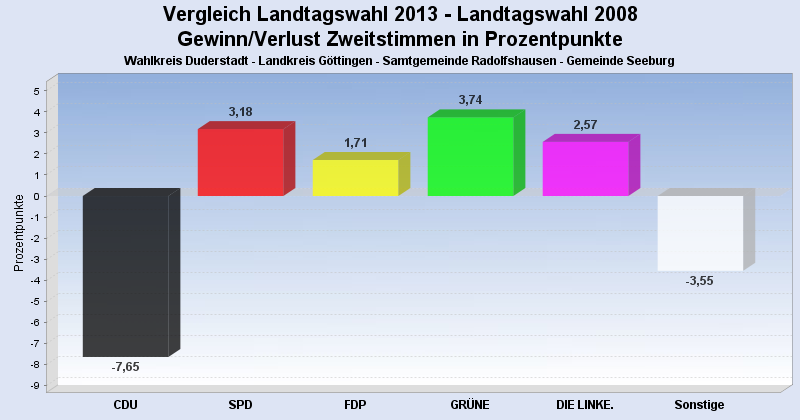
Ergebnis zur Landtagswahl 2013 am 20.01.2013
Wahlkreis Duderstadt - Landkreis Göttingen - Samtgemeinde Radolfshausen - Gemeinde Seeburg
Es wurden alle Wahlbezirke ausgewertet.
 Diagramm
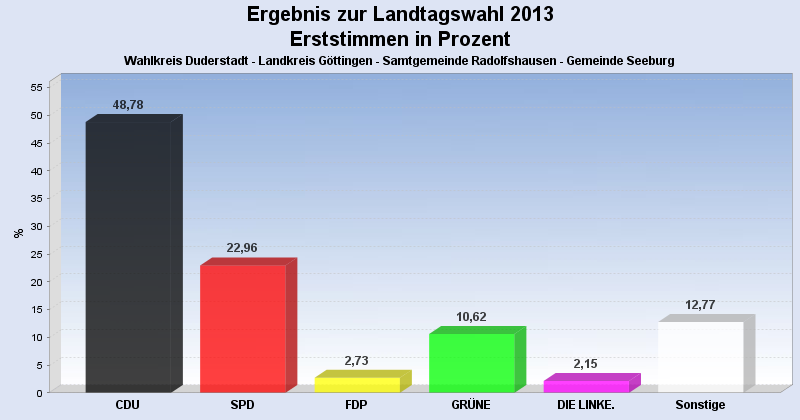
 Seitenanfang
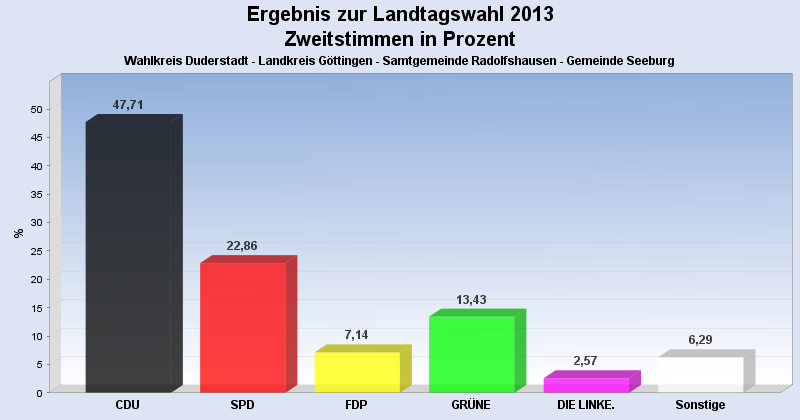
Wahlbeteiligung, Stimmzettel, Stimmen
| Wahlbeteiligung: | 53,88% |
|---|---|
| Stimmberechtigte: | 1.314 |
| Wähler: | 708 |
| Ungültige Erststimmen: | 11 |
| Gültige Erststimmen: | 697 |
| Ungültige Zweitstimmen: | 8 |
| Gültige Zweitstimmen: | 700 |
Erststimmen nach Wahlvorschlag
| Partei | Erststimmen | Prozent | |
|---|---|---|---|
| 1 | Koch, Lothar ( CDU ) | 340 | 48,78% |
| 2 | Glahn, Doris ( SPD ) | 160 | 22,96% |
| 3 | Duensing, Margret ( FDP ) | 19 | 2,73% |
| 4 | Kollenrott, Marie ( GRÜNE ) | 74 | 10,62% |
| 5 | Dr. Fascher, Eckhard ( DIE LINKE. ) | 15 | 2,15% |
| 12 | Ehbrecht, Dietmar ( FREIE WÄHLER ) | 85 | 12,20% |
| 20 | Richard, Klaus-Dieter ( PIRATEN ) | 4 | 0,57% |
Zweitstimmen nach Wahlvorschlag
| Partei | Zweitstimmen | Prozent | |
|---|---|---|---|
| 1 | CDU | 334 | 47,71% |
| 2 | SPD | 160 | 22,86% |
| 3 | FDP | 50 | 7,14% |
| 4 | GRÜNE | 94 | 13,43% |
| 5 | DIE LINKE. | 18 | 2,57% |
| 6 | Bündnis 21/RRP | 0 | 0,00% |
| 9 | DIE FREIHEIT Niedersachsen | 2 | 0,29% |
| 12 | FREIE WÄHLER | 32 | 4,57% |
| 14 | NPD | 3 | 0,43% |
| 16 | PBC | 1 | 0,14% |
| 20 | PIRATEN | 6 | 0,86% |
- Stand: 30.01.2013 14:19:01