Ergebnis zur Landtagswahl 2013 am 20.01.2013
Wahlkreis Duderstadt - Landkreis Göttingen - Samtgemeinde Radolfshausen - Gemeinde Waake
Es wurden alle Wahlbezirke ausgewertet.
 Diagramm
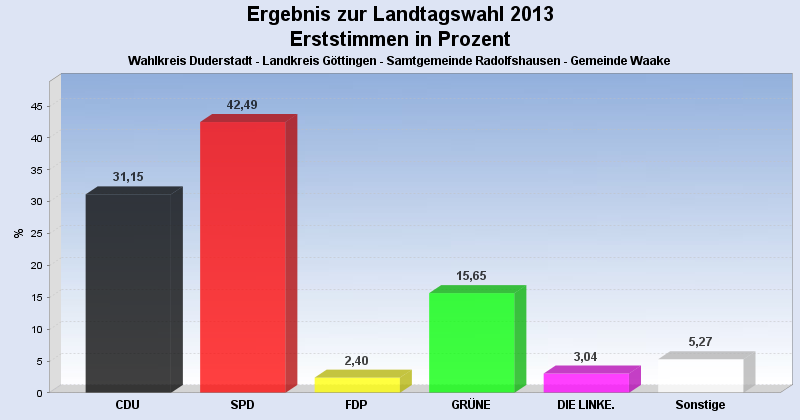
 Seitenanfang
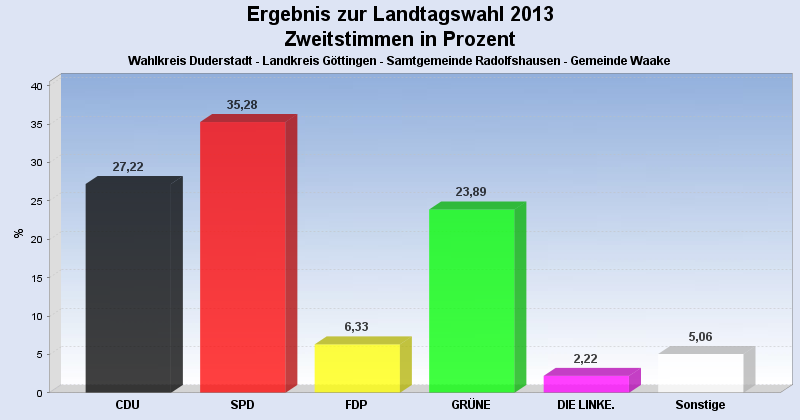
Wahlbeteiligung, Stimmzettel, Stimmen
| Wahlbeteiligung: | 60,72% |
|---|---|
| Stimmberechtigte: | 1.049 |
| Wähler: | 637 |
| Ungültige Erststimmen: | 11 |
| Gültige Erststimmen: | 626 |
| Ungültige Zweitstimmen: | 5 |
| Gültige Zweitstimmen: | 632 |
Erststimmen nach Wahlvorschlag
| Partei | Erststimmen | Prozent | |
|---|---|---|---|
| 1 | Koch, Lothar ( CDU ) | 195 | 31,15% |
| 2 | Glahn, Doris ( SPD ) | 266 | 42,49% |
| 3 | Duensing, Margret ( FDP ) | 15 | 2,40% |
| 4 | Kollenrott, Marie ( GRÜNE ) | 98 | 15,65% |
| 5 | Dr. Fascher, Eckhard ( DIE LINKE. ) | 19 | 3,04% |
| 12 | Ehbrecht, Dietmar ( FREIE WÄHLER ) | 20 | 3,19% |
| 20 | Richard, Klaus-Dieter ( PIRATEN ) | 13 | 2,08% |
Zweitstimmen nach Wahlvorschlag
| Partei | Zweitstimmen | Prozent | |
|---|---|---|---|
| 1 | CDU | 172 | 27,22% |
| 2 | SPD | 223 | 35,28% |
| 3 | FDP | 40 | 6,33% |
| 4 | GRÜNE | 151 | 23,89% |
| 5 | DIE LINKE. | 14 | 2,22% |
| 6 | Bündnis 21/RRP | 0 | 0,00% |
| 9 | DIE FREIHEIT Niedersachsen | 3 | 0,47% |
| 12 | FREIE WÄHLER | 15 | 2,37% |
| 14 | NPD | 6 | 0,95% |
| 16 | PBC | 0 | 0,00% |
| 20 | PIRATEN | 8 | 1,27% |
- Stand: 30.01.2013 14:19:05