Ergebnis zur Landtagswahl 2013 am 20.01.2013
Wahlkreis Duderstadt - Landkreis Göttingen - Samtgemeinde Gieboldehausen
Es wurden alle Wahlbezirke ausgewertet.
 Diagramm
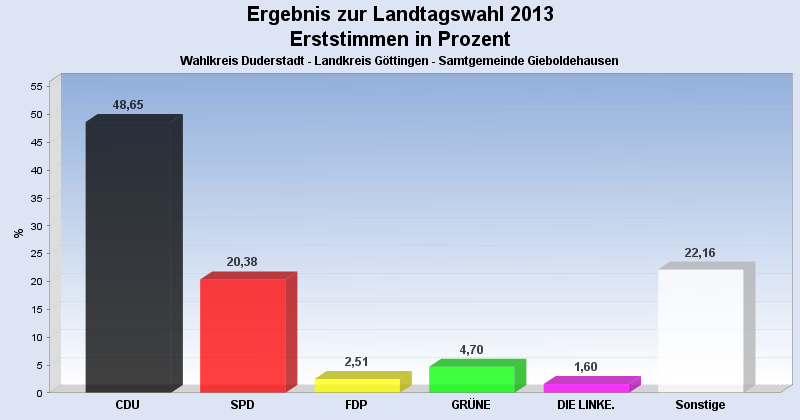
 Seitenanfang
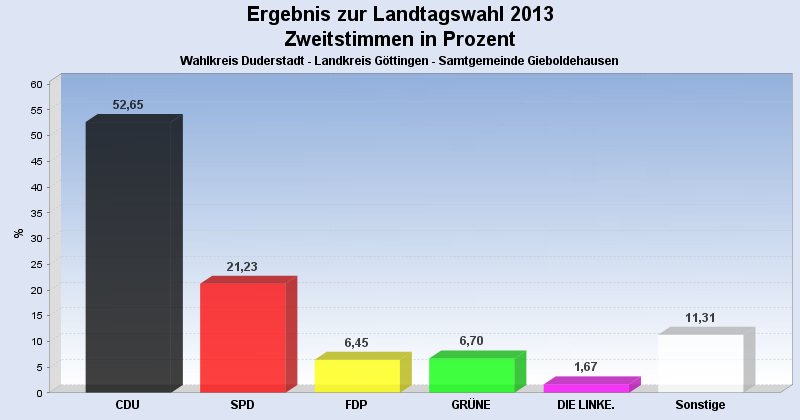
Wahlbeteiligung, Stimmzettel, Stimmen
| Wahlbeteiligung: | 62,79% |
|---|---|
| Stimmberechtigte: | 11.286 |
| Wähler: | 7.087 |
| Ungültige Erststimmen: | 105 |
| Gültige Erststimmen: | 6.982 |
| Ungültige Zweitstimmen: | 82 |
| Gültige Zweitstimmen: | 7.005 |
Erststimmen nach Wahlvorschlag
| Partei | Erststimmen | Prozent | |
|---|---|---|---|
| 1 | Koch, Lothar ( CDU ) | 3.397 | 48,65% |
| 2 | Glahn, Doris ( SPD ) | 1.423 | 20,38% |
| 3 | Duensing, Margret ( FDP ) | 175 | 2,51% |
| 4 | Kollenrott, Marie ( GRÜNE ) | 328 | 4,70% |
| 5 | Dr. Fascher, Eckhard ( DIE LINKE. ) | 112 | 1,60% |
| 12 | Ehbrecht, Dietmar ( FREIE WÄHLER ) | 1.474 | 21,11% |
| 20 | Richard, Klaus-Dieter ( PIRATEN ) | 73 | 1,05% |
Zweitstimmen nach Wahlvorschlag
| Partei | Zweitstimmen | Prozent | |
|---|---|---|---|
| 1 | CDU | 3.688 | 52,65% |
| 2 | SPD | 1.487 | 21,23% |
| 3 | FDP | 452 | 6,45% |
| 4 | GRÜNE | 469 | 6,70% |
| 5 | DIE LINKE. | 117 | 1,67% |
| 6 | Bündnis 21/RRP | 0 | 0,00% |
| 9 | DIE FREIHEIT Niedersachsen | 26 | 0,37% |
| 12 | FREIE WÄHLER | 642 | 9,16% |
| 14 | NPD | 43 | 0,61% |
| 16 | PBC | 3 | 0,04% |
| 20 | PIRATEN | 78 | 1,11% |
- Stand: 30.01.2013 14:18:20