Ergebnis zur Landtagswahl 2013 am 20.01.2013
Wahlkreis Duderstadt - Landkreis Göttingen - Samtgemeinde Radolfshausen
Es wurden alle Wahlbezirke ausgewertet.
 Diagramm
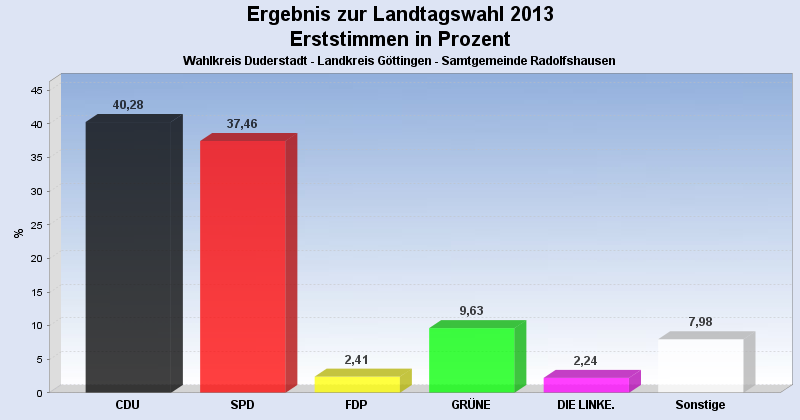
 Seitenanfang
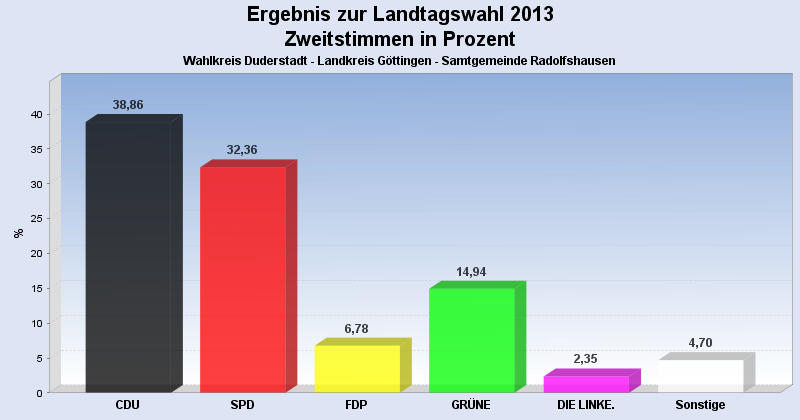
Wahlbeteiligung, Stimmzettel, Stimmen
| Wahlbeteiligung: | 67,49% |
|---|---|
| Stimmberechtigte: | 5.924 |
| Wähler: | 3.998 |
| Ungültige Erststimmen: | 63 |
| Gültige Erststimmen: | 3.935 |
| Ungültige Zweitstimmen: | 43 |
| Gültige Zweitstimmen: | 3.955 |
Erststimmen nach Wahlvorschlag
| Partei | Erststimmen | Prozent | |
|---|---|---|---|
| 1 | Koch, Lothar ( CDU ) | 1.585 | 40,28% |
| 2 | Glahn, Doris ( SPD ) | 1.474 | 37,46% |
| 3 | Duensing, Margret ( FDP ) | 95 | 2,41% |
| 4 | Kollenrott, Marie ( GRÜNE ) | 379 | 9,63% |
| 5 | Dr. Fascher, Eckhard ( DIE LINKE. ) | 88 | 2,24% |
| 12 | Ehbrecht, Dietmar ( FREIE WÄHLER ) | 274 | 6,96% |
| 20 | Richard, Klaus-Dieter ( PIRATEN ) | 40 | 1,02% |
Zweitstimmen nach Wahlvorschlag
| Partei | Zweitstimmen | Prozent | |
|---|---|---|---|
| 1 | CDU | 1.537 | 38,86% |
| 2 | SPD | 1.280 | 32,36% |
| 3 | FDP | 268 | 6,78% |
| 4 | GRÜNE | 591 | 14,94% |
| 5 | DIE LINKE. | 93 | 2,35% |
| 6 | Bündnis 21/RRP | 0 | 0,00% |
| 9 | DIE FREIHEIT Niedersachsen | 14 | 0,35% |
| 12 | FREIE WÄHLER | 106 | 2,68% |
| 14 | NPD | 25 | 0,63% |
| 16 | PBC | 4 | 0,10% |
| 20 | PIRATEN | 37 | 0,94% |
- Stand: 30.01.2013 14:18:42