Ergebnis zur Landtagswahl 2013 am 20.01.2013
Wahlkreis Duderstadt - Landkreis Göttingen - Samtgemeinde Gieboldehausen - Gemeinde Gieboldehausen
Es wurden alle Wahlbezirke ausgewertet.
 Diagramm
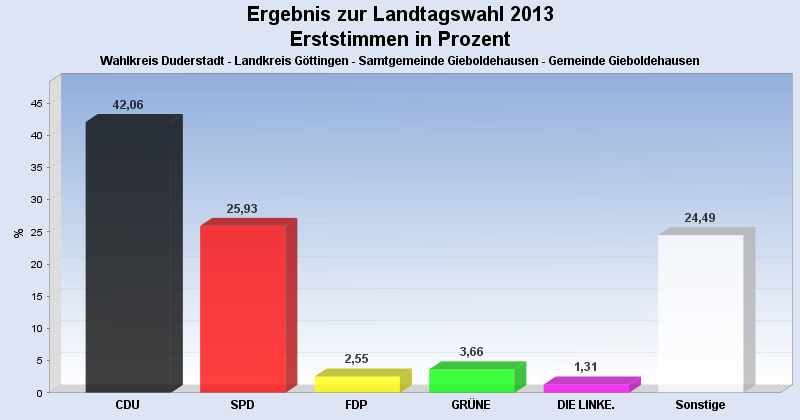
 Seitenanfang
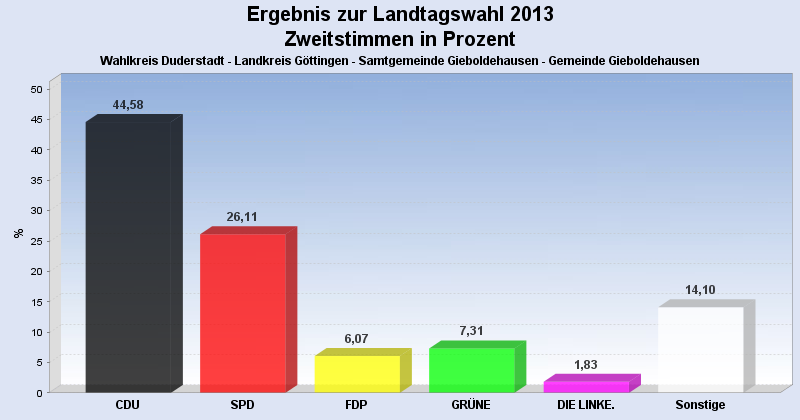
Wahlbeteiligung, Stimmzettel, Stimmen
| Wahlbeteiligung: | 47,83% |
|---|---|
| Stimmberechtigte: | 3.251 |
| Wähler: | 1.555 |
| Ungültige Erststimmen: | 24 |
| Gültige Erststimmen: | 1.531 |
| Ungültige Zweitstimmen: | 23 |
| Gültige Zweitstimmen: | 1.532 |
Erststimmen nach Wahlvorschlag
| Partei | Erststimmen | Prozent | |
|---|---|---|---|
| 1 | Koch, Lothar ( CDU ) | 644 | 42,06% |
| 2 | Glahn, Doris ( SPD ) | 397 | 25,93% |
| 3 | Duensing, Margret ( FDP ) | 39 | 2,55% |
| 4 | Kollenrott, Marie ( GRÜNE ) | 56 | 3,66% |
| 5 | Dr. Fascher, Eckhard ( DIE LINKE. ) | 20 | 1,31% |
| 12 | Ehbrecht, Dietmar ( FREIE WÄHLER ) | 361 | 23,58% |
| 20 | Richard, Klaus-Dieter ( PIRATEN ) | 14 | 0,91% |
Zweitstimmen nach Wahlvorschlag
| Partei | Zweitstimmen | Prozent | |
|---|---|---|---|
| 1 | CDU | 683 | 44,58% |
| 2 | SPD | 400 | 26,11% |
| 3 | FDP | 93 | 6,07% |
| 4 | GRÜNE | 112 | 7,31% |
| 5 | DIE LINKE. | 28 | 1,83% |
| 6 | Bündnis 21/RRP | 0 | 0,00% |
| 9 | DIE FREIHEIT Niedersachsen | 10 | 0,65% |
| 12 | FREIE WÄHLER | 186 | 12,14% |
| 14 | NPD | 9 | 0,59% |
| 16 | PBC | 0 | 0,00% |
| 20 | PIRATEN | 11 | 0,72% |
- Stand: 30.01.2013 14:18:17