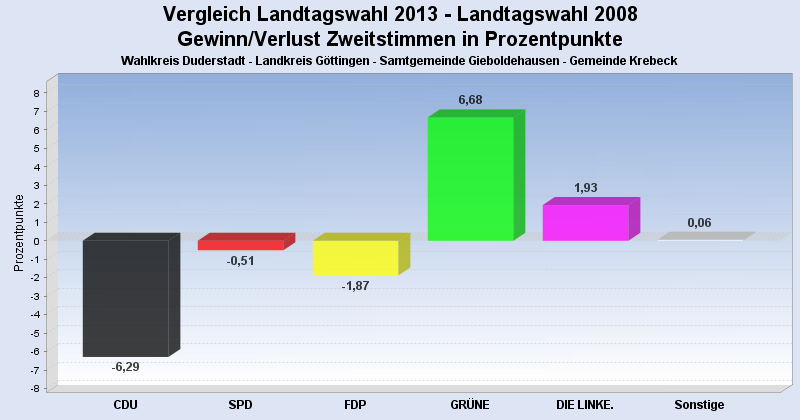
Ergebnis zur Landtagswahl 2013 am 20.01.2013
Wahlkreis Duderstadt - Landkreis Göttingen - Samtgemeinde Gieboldehausen - Gemeinde Krebeck
Es wurden alle Wahlbezirke ausgewertet.
 Diagramm
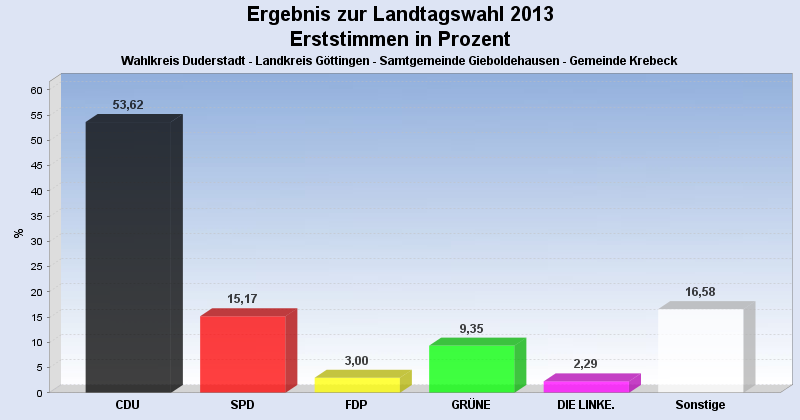
 Seitenanfang
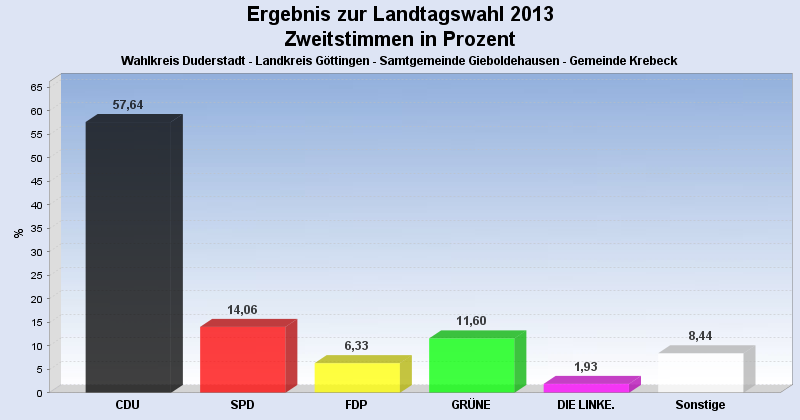
Wahlbeteiligung, Stimmzettel, Stimmen
| Wahlbeteiligung: | 65,12% |
|---|---|
| Stimmberechtigte: | 883 |
| Wähler: | 575 |
| Ungültige Erststimmen: | 8 |
| Gültige Erststimmen: | 567 |
| Ungültige Zweitstimmen: | 6 |
| Gültige Zweitstimmen: | 569 |
Erststimmen nach Wahlvorschlag
| Partei | Erststimmen | Prozent | |
|---|---|---|---|
| 1 | Koch, Lothar ( CDU ) | 304 | 53,62% |
| 2 | Glahn, Doris ( SPD ) | 86 | 15,17% |
| 3 | Duensing, Margret ( FDP ) | 17 | 3,00% |
| 4 | Kollenrott, Marie ( GRÜNE ) | 53 | 9,35% |
| 5 | Dr. Fascher, Eckhard ( DIE LINKE. ) | 13 | 2,29% |
| 12 | Ehbrecht, Dietmar ( FREIE WÄHLER ) | 91 | 16,05% |
| 20 | Richard, Klaus-Dieter ( PIRATEN ) | 3 | 0,53% |
Zweitstimmen nach Wahlvorschlag
| Partei | Zweitstimmen | Prozent | |
|---|---|---|---|
| 1 | CDU | 328 | 57,64% |
| 2 | SPD | 80 | 14,06% |
| 3 | FDP | 36 | 6,33% |
| 4 | GRÜNE | 66 | 11,60% |
| 5 | DIE LINKE. | 11 | 1,93% |
| 6 | Bündnis 21/RRP | 0 | 0,00% |
| 9 | DIE FREIHEIT Niedersachsen | 4 | 0,70% |
| 12 | FREIE WÄHLER | 38 | 6,68% |
| 14 | NPD | 2 | 0,35% |
| 16 | PBC | 0 | 0,00% |
| 20 | PIRATEN | 4 | 0,70% |
- Stand: 30.01.2013 14:18:35