Ergebnis zur Landtagswahl 2013 am 20.01.2013
Wahlkreis Duderstadt - Landkreis Göttingen - Samtgemeinde Gieboldehausen - Gemeinde Obernfeld
Es wurden alle Wahlbezirke ausgewertet.
 Diagramm
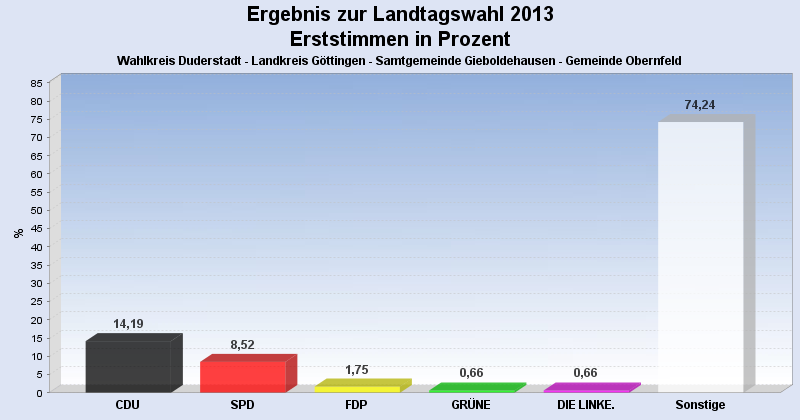
 Seitenanfang
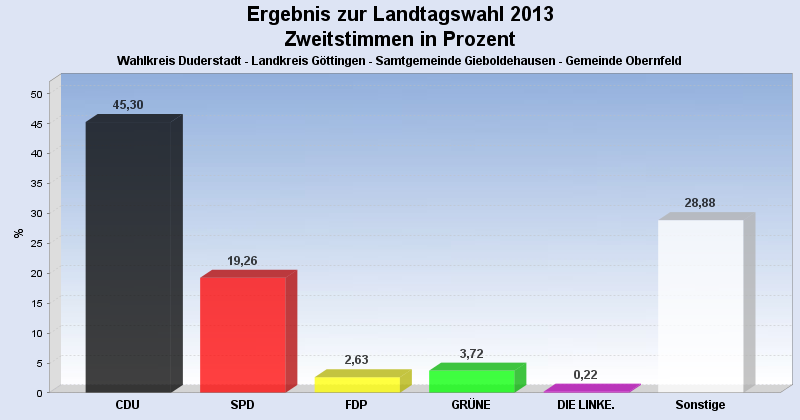
Wahlbeteiligung, Stimmzettel, Stimmen
| Wahlbeteiligung: | 58,45% |
|---|---|
| Stimmberechtigte: | 799 |
| Wähler: | 467 |
| Ungültige Erststimmen: | 9 |
| Gültige Erststimmen: | 458 |
| Ungültige Zweitstimmen: | 10 |
| Gültige Zweitstimmen: | 457 |
Erststimmen nach Wahlvorschlag
| Partei | Erststimmen | Prozent | |
|---|---|---|---|
| 1 | Koch, Lothar ( CDU ) | 65 | 14,19% |
| 2 | Glahn, Doris ( SPD ) | 39 | 8,52% |
| 3 | Duensing, Margret ( FDP ) | 8 | 1,75% |
| 4 | Kollenrott, Marie ( GRÜNE ) | 3 | 0,66% |
| 5 | Dr. Fascher, Eckhard ( DIE LINKE. ) | 3 | 0,66% |
| 12 | Ehbrecht, Dietmar ( FREIE WÄHLER ) | 339 | 74,02% |
| 20 | Richard, Klaus-Dieter ( PIRATEN ) | 1 | 0,22% |
Zweitstimmen nach Wahlvorschlag
| Partei | Zweitstimmen | Prozent | |
|---|---|---|---|
| 1 | CDU | 207 | 45,30% |
| 2 | SPD | 88 | 19,26% |
| 3 | FDP | 12 | 2,63% |
| 4 | GRÜNE | 17 | 3,72% |
| 5 | DIE LINKE. | 1 | 0,22% |
| 6 | Bündnis 21/RRP | 0 | 0,00% |
| 9 | DIE FREIHEIT Niedersachsen | 1 | 0,22% |
| 12 | FREIE WÄHLER | 127 | 27,79% |
| 14 | NPD | 1 | 0,22% |
| 16 | PBC | 0 | 0,00% |
| 20 | PIRATEN | 3 | 0,66% |
- Stand: 30.01.2013 14:18:40