Ergebnis zur Landtagswahl 2013 am 20.01.2013
Wahlkreis Duderstadt - Landkreis Göttingen - Samtgemeinde Gieboldehausen - Gemeinde Wollbrandshausen
Es wurden alle Wahlbezirke ausgewertet.
 Diagramm
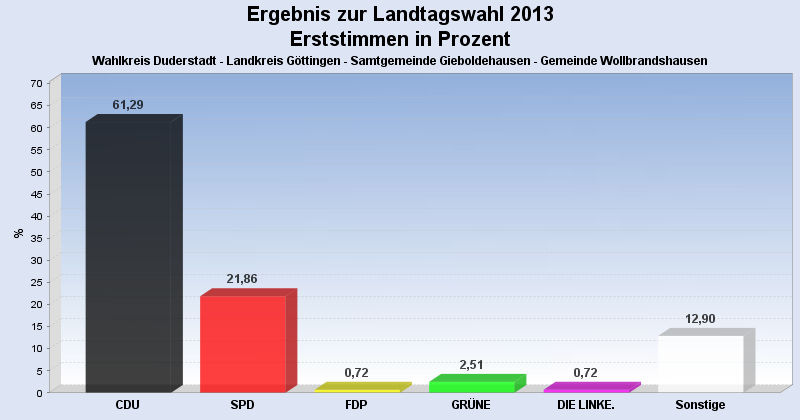
 Seitenanfang
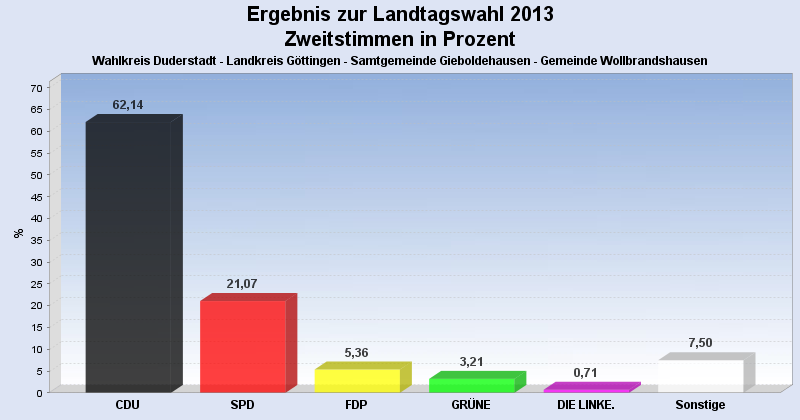
Wahlbeteiligung, Stimmzettel, Stimmen
| Wahlbeteiligung: | 54,97% |
|---|---|
| Stimmberechtigte: | 513 |
| Wähler: | 282 |
| Ungültige Erststimmen: | 3 |
| Gültige Erststimmen: | 279 |
| Ungültige Zweitstimmen: | 2 |
| Gültige Zweitstimmen: | 280 |
Erststimmen nach Wahlvorschlag
| Partei | Erststimmen | Prozent | |
|---|---|---|---|
| 1 | Koch, Lothar ( CDU ) | 171 | 61,29% |
| 2 | Glahn, Doris ( SPD ) | 61 | 21,86% |
| 3 | Duensing, Margret ( FDP ) | 2 | 0,72% |
| 4 | Kollenrott, Marie ( GRÜNE ) | 7 | 2,51% |
| 5 | Dr. Fascher, Eckhard ( DIE LINKE. ) | 2 | 0,72% |
| 12 | Ehbrecht, Dietmar ( FREIE WÄHLER ) | 34 | 12,19% |
| 20 | Richard, Klaus-Dieter ( PIRATEN ) | 2 | 0,72% |
Zweitstimmen nach Wahlvorschlag
| Partei | Zweitstimmen | Prozent | |
|---|---|---|---|
| 1 | CDU | 174 | 62,14% |
| 2 | SPD | 59 | 21,07% |
| 3 | FDP | 15 | 5,36% |
| 4 | GRÜNE | 9 | 3,21% |
| 5 | DIE LINKE. | 2 | 0,71% |
| 6 | Bündnis 21/RRP | 0 | 0,00% |
| 9 | DIE FREIHEIT Niedersachsen | 0 | 0,00% |
| 12 | FREIE WÄHLER | 19 | 6,79% |
| 14 | NPD | 0 | 0,00% |
| 16 | PBC | 0 | 0,00% |
| 20 | PIRATEN | 2 | 0,71% |
- Stand: 30.01.2013 14:19:07