Ergebnis zur Landtagswahl 2013 am 20.01.2013
Wahlkreis Duderstadt - Landkreis Göttingen - Samtgemeinde Gieboldehausen - Gemeinde Wollershausen
Es wurden alle Wahlbezirke ausgewertet.
 Diagramm
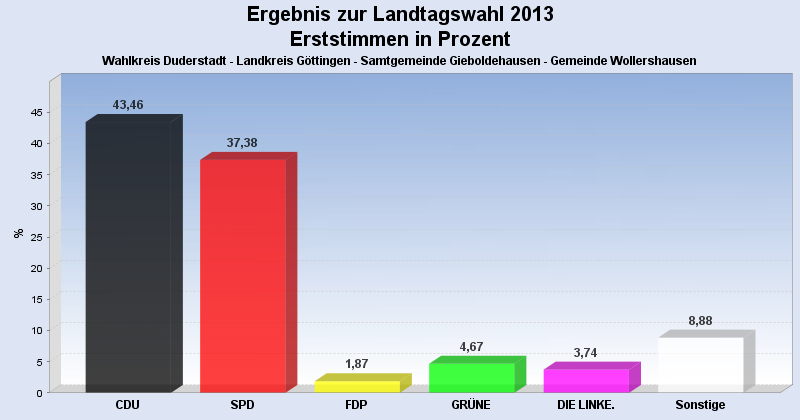
 Seitenanfang
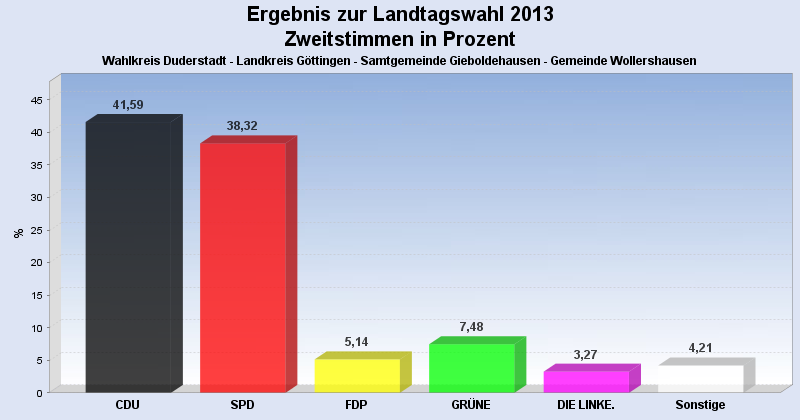
Wahlbeteiligung, Stimmzettel, Stimmen
| Wahlbeteiligung: | 60,85% |
|---|---|
| Stimmberechtigte: | 355 |
| Wähler: | 216 |
| Ungültige Erststimmen: | 2 |
| Gültige Erststimmen: | 214 |
| Ungültige Zweitstimmen: | 2 |
| Gültige Zweitstimmen: | 214 |
Erststimmen nach Wahlvorschlag
| Partei | Erststimmen | Prozent | |
|---|---|---|---|
| 1 | Koch, Lothar ( CDU ) | 93 | 43,46% |
| 2 | Glahn, Doris ( SPD ) | 80 | 37,38% |
| 3 | Duensing, Margret ( FDP ) | 4 | 1,87% |
| 4 | Kollenrott, Marie ( GRÜNE ) | 10 | 4,67% |
| 5 | Dr. Fascher, Eckhard ( DIE LINKE. ) | 8 | 3,74% |
| 12 | Ehbrecht, Dietmar ( FREIE WÄHLER ) | 18 | 8,41% |
| 20 | Richard, Klaus-Dieter ( PIRATEN ) | 1 | 0,47% |
Zweitstimmen nach Wahlvorschlag
| Partei | Zweitstimmen | Prozent | |
|---|---|---|---|
| 1 | CDU | 89 | 41,59% |
| 2 | SPD | 82 | 38,32% |
| 3 | FDP | 11 | 5,14% |
| 4 | GRÜNE | 16 | 7,48% |
| 5 | DIE LINKE. | 7 | 3,27% |
| 6 | Bündnis 21/RRP | 0 | 0,00% |
| 9 | DIE FREIHEIT Niedersachsen | 0 | 0,00% |
| 12 | FREIE WÄHLER | 6 | 2,80% |
| 14 | NPD | 1 | 0,47% |
| 16 | PBC | 0 | 0,00% |
| 20 | PIRATEN | 2 | 0,93% |
- Stand: 30.01.2013 14:19:09